

The gold-to-silver ratio equals the price of gold per troy ounce divided by the price of silver per troy ounce. Divide today’s gold spot price by today’s silver spot price and you get a single number, expressed as ounces of silver to one ounce of gold, according to Britannica.
A high ratio means silver is cheap relative to gold. A low ratio means silver is expensive relative to gold, or gold is cheap relative to silver, depending on which metal moved. Investors watch this number as a relative-value gauge, not a crystal ball. It tells you how the two metals are priced against each other right now, compared with history. It does not predict where either price goes next.
- Formula: gold spot price ÷ silver spot price = ratio (expressed as X:1)
- High ratio indicates silver looks relatively cheap versus gold
- Low ratio (historically below 50) = silver looks relatively expensive versus gold
Quick fact: A recent cointegration study puts the long-run equilibrium for this ratio near 59.65, a benchmark that helps investors judge whether today’s reading sits far from its historical center.
Key Takeaways
The gold-to-silver ratio measures relative value between the two metals, and disciplined, long-term allocation decisions outperform reactive trades built around any single ratio reading.
| Point | Details |
|---|---|
| Core formula | Divide gold’s spot price by silver’s spot price to get the ratio, expressed as ounces of silver to one ounce of gold. |
| Long-run equilibrium | Cointegration analysis places the historical mean near 59.65, useful as a benchmark for context. |
| Correction pace | Deviations from the mean have historically taken around 17.3 months on average to half-correct, arguing against short-term timing bets. |
| Main drivers | Central-bank gold buying, silver’s industrial demand, and shifting Chinese demand patterns move the ratio in different directions. |
| Apply it with GoldRock | GoldRock Metal Exchange offers self-directed IRA rollovers, insured private delivery, and one-on-one guidance for turning ratio analysis into an actual allocation decision. |
Table of Contents
- How Do You Calculate the Silver-to-Gold Ratio?
- What Does a High or Low Ratio Mean for Investors?
- Where Does the Ratio Sit Historically, and Why Does That Matter?
- What Moves the Gold-to-Silver Ratio, and Where Does It Fall Short?
- How Do You Apply the Ratio to a Real Purchase Decision?
- How Do You Turn This Into an Allocation Decision?
- Is There a Difference Between “Gold-to-Silver” and “Silver-to-Gold” Ratio?
- How Does This Ratio Compare to Other Precious Metals Valuation Metrics?
- How Have Investors Used Ratio Shifts to Adjust Strategy?
- Sources
How Do You Calculate the Silver-to-Gold Ratio?
Take gold’s spot price and divide it by silver’s spot price. That’s the entire calculation. One recent live snapshot showed gold at $4,153.53 and silver at $61.87 per troy ounce, producing a ratio of roughly 67.13:1. That means it would take about 67 ounces of silver to equal the value of one ounce of gold at that moment.
A few mechanics matter here:
- Use troy ounces, not standard ounces. Precious metals are priced in troy ounces (about 31.1 grams), so mixing units will throw off your math.
- Know your price source. Spot price reflects the wholesale market price right now. Dealer ask price (what you pay to buy) and bid price (what a dealer pays to buy from you) sit slightly above and below spot.
- Check the COMEX trading window. The ratio shifts continuously while gold and silver futures trade on COMEX, so a number pulled mid-session can differ from the closing print.
You can track live pricing for both metals through GoldRock Metal Exchange’s live prices page, which updates during market hours.
Pro Tip: When you compare ratio readings across different sources, confirm whether they’re using spot price or dealer ask price. Ask prices run higher, which can make the ratio look different from a pure spot calculation.
What Does a High or Low Ratio Mean for Investors?
Historical readings have ranged widely. Investopedia notes the ratio dropped to around 31 in April 2011 and spiked past 125 in April 2020. Most of the time, though, it trades somewhere in a broad middle zone. Investors generally think about it in rough bands:
- Below 50: Silver is historically expensive relative to gold, a rare zone reached during silver-focused buying manias.
- 50 to 80: A common trading range where the ratio has spent much of the past two decades.
- 80 to 100: Silver looks relatively cheap; some investors start watching for rebalancing opportunities.
- Above 100: An extreme reading, historically associated with market stress or a sharp gold rally outpacing silver.
Here’s the part that gets lost in a lot of coverage: these bands are context, not triggers. An investor who sees the ratio near 90 might choose to shift a portion of new precious-metals purchases toward silver, or rebalance an existing holding incrementally through dollar-cost averaging, rather than making one large, timed bet. That’s a meaningfully different approach than trying to call a top or bottom.
Financial commentary consistently frames the ratio as one input among several, not a standalone signal, and CBS News coverage citing financial advisors makes the same point: it’s useful for context, not for precision timing. Pair it with your own allocation targets, time horizon, and risk tolerance before acting.
Where Does the Ratio Sit Historically, and Why Does That Matter?
Context is everything with this number. A ratio of 75 means very different things depending on whether the long-run average sits at 50 or 65.
A Johansen cointegration test run on monthly data found a long-run equilibrium near 59.65, with deviations from that level historically correcting over an average half-life of about 17.3 months, and gold’s price movements tend to drive those corrections more often than silver’s, according to the Silver Institute’s analysis.
The ratio is mean-reverting, but “mean-reverting” doesn’t mean fast. A year and a half is the average time for half of a deviation to close. Extended stretches well above or below the historical center are the norm, not the exception, which is exactly why treating any single reading as an urgent buy signal misreads what the statistics actually show.
The extremes tell their own story. The ratio touched roughly 31 in 2011 during a silver price surge, then blew out past 125 in 2020 amid a pandemic-driven gold rally paired with a silver demand collapse, per Investopedia.
| Period | Approximate Ratio | Context |
|---|---|---|
| U.S. Coinage Act of 1792 | 15:1 (fixed) | Government-set exchange rate, not market-driven |
| April 2011 | ~31:1 | Silver price surge compressed the ratio |
| Long-run equilibrium (cointegration estimate) | ~59.65:1 | Statistical mean from Silver Institute analysis |
| April 2020 | 125+:1 | Gold rally paired with a silver demand shock |
Long before floating markets, governments fixed the ratio outright. The Coinage Act of 1792 set the U.S. rate at 15 ounces of silver per ounce of gold, a reminder that this relationship has been a unit-of-account question for over two centuries, not a modern trading invention.
What Moves the Gold-to-Silver Ratio, and Where Does It Fall Short?
The ratio doesn’t move on its own. It moves because gold and silver respond to different forces, sometimes in opposite directions.
- Central-bank gold buying. Sustained institutional demand for gold, largely absent from silver markets, has been a dominant driver of gold’s price since the early 2000s, per CME Group’s research.
- Industrial demand for silver. Silver’s use in solar panel manufacturing has become a structural demand source that gold simply doesn’t have, according to the Silver Institute.
- Photography’s decline. A shrinking source of silver demand that once mattered far more than it does today, per CME Group.
- Chinese demand patterns. Shifts in Chinese buying affect both metals, but not always proportionally.
- Dollar and interest-rate moves. Both metals react to real interest rates and currency strength, though gold tends to respond more to investment flows and silver more to industrial cycles.
The limitation worth sitting with: because gold’s investment demand has become the larger driver of the pair, ratio swings often say more about capital flowing into or out of gold than anything happening in the silver market. That’s a subtlety easy to miss if you only watch the ratio number itself.
Pro Tip: Don’t use the ratio alone for short-term trades. It’s a slow-moving, long-horizon indicator. Treat sharp weekly swings as noise unless they’re backed by a clear shift in one of the drivers above.
How Do You Apply the Ratio to a Real Purchase Decision?
Numbers help more than abstractions here. Using the earlier live snapshot, gold at $4,153.53 and silver at $61.87 per troy ounce works out to $4,153.53 ÷ $61.87 = 67.13, meaning it takes about 67 ounces of silver to match one ounce of gold in value.
Two ways investors respond to a reading like that:
- Long-term rebalancing. An investor holding mostly gold might direct new purchases toward silver in smaller increments over several months, treating a ratio above the historical mean as a reason to lean toward silver without abandoning gold entirely. This spreads the decision across time instead of betting on one entry point.
- The tempting shortcut, and why it’s risky. Some investors try to time a single large trade around an extreme ratio reading, betting on a fast reversion. Given that corrections have historically played out over roughly a year and a half on average, per the Silver Institute’s half-life estimate, a short-term bet built on a quick reversion assumption can sit underwater for a long stretch even if the long-term thesis eventually proves right.
The difference between these two approaches is patience. One treats the ratio as a directional nudge inside a broader plan. The other treats it as a stopwatch, which the underlying statistics don’t support.
How Do You Turn This Into an Allocation Decision?
Understanding the ratio is one thing. Acting on it responsibly is another. A simple checklist helps:
- Check the current live ratio against the long-run average before making a purchase decision.
- Compare that reading to your own target allocation between gold and silver, not just the historical mean.
- Set a rebalancing rule in advance, such as adjusting new purchases by a fixed percentage rather than reacting emotionally to a headline number.
- Document your exposure limits per metal so a single extreme reading doesn’t push you into an oversized position.
Ownership method matters as much as timing. Physical delivery gives you direct possession and control. Allocated storage keeps your specific metal segregated and identifiable rather than commingled. A self-directed Precious Metals IRA lets you hold physical gold, silver, platinum, or palladium inside a tax-advantaged retirement account, an option worth understanding fully before rolling over existing retirement funds, as portfolio diversification principles generally suggest weighing tax treatment and custody together.
GoldRock Metal Exchange’s in-house IRA department handles the mechanics of rolling retirement funds into physical metals, and its insured private delivery service covers investors who prefer direct possession over third-party storage. If you’re weighing how the ratio fits into either path, Request a Free Precious Metals Consultation by calling (888) 859-0978.
Is There a Difference Between “Gold-to-Silver” and “Silver-to-Gold” Ratio?
Both phrases describe the same relationship, calculated the same way: gold’s price divided by silver’s price. “Gold-to-silver ratio” is the more common convention in financial media and among dealers, and it’s the version cited by Britannica and Investopedia.
“Silver-to-gold ratio” is used less frequently but almost always refers to the identical calculation, not an inverted one. If someone actually inverts the math (silver price ÷ gold price), they get a completely different, much smaller number, typically a fraction like 0.015, which isn’t how the term is conventionally used or reported anywhere in mainstream precious metals coverage.
The practical takeaway: when you see either phrase, assume it means gold’s price divided by silver’s price unless the source explicitly states otherwise. The confusion tends to arise because the word order suggests a fraction that isn’t actually being calculated. Reputable data providers, live pricing tools, and financial publications treat the two phrasings as interchangeable labels for the same number, so you don’t need to recalculate anything when you see one term versus the other. What matters is confirming the actual formula the source used, which almost universally follows the gold-divided-by-silver convention regardless of which name gets attached to the result.
How Does This Ratio Compare to Other Precious Metals Valuation Metrics?
The gold-to-silver ratio gets the most attention, but it isn’t the only relative-value metric investors use. A platinum-to-gold ratio and a palladium-to-gold ratio exist too, tracking how those metals price against gold over time. Platinum has historically traded both above and below gold’s price, depending heavily on automotive catalytic converter demand and mining supply disruptions concentrated in South Africa and Russia.
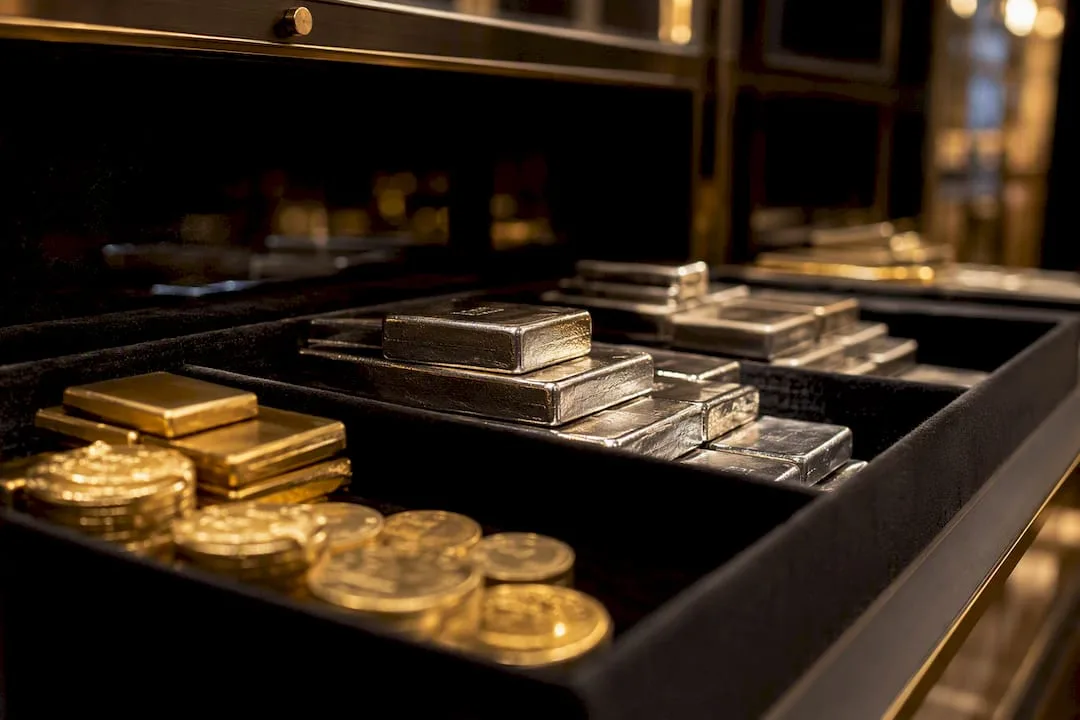
What sets the gold-to-silver ratio apart is data depth. It has centuries of recorded pricing history, going back to government-fixed rates like the 1792 Coinage Act, giving it a longer track record than platinum or palladium comparisons, which only became actively traded relative-value pairs in the twentieth century.
Another distinction: gold and silver both function partly as monetary metals with investment demand, while platinum and palladium lean more heavily on industrial and automotive use. That makes the gold-to-silver ratio somewhat more useful as a barometer of investor sentiment specifically, since both sides of the equation carry meaningful investment demand rather than one side being almost purely industrial. None of these ratios function as a valuation metric in the sense of a price-to-earnings ratio for stocks. They’re comparative pricing tools, useful for understanding relative positioning between two assets, not for calculating intrinsic worth. Investors who track multiple ratios side by side tend to use them as a broader sentiment dashboard rather than relying on any single pair in isolation.
How Have Investors Used Ratio Shifts to Adjust Strategy?
A few patterns show up repeatedly among investors who track this number seriously.
The first is incremental metal-swapping. When the ratio climbs well above its historical range, some investors trade a portion of gold holdings for a larger quantity of silver, effectively acquiring more total ounces of precious metal for the same dollar value, then reversing the trade if the ratio compresses substantially later. This works only as a multi-year strategy, given how slowly the ratio has historically corrected.
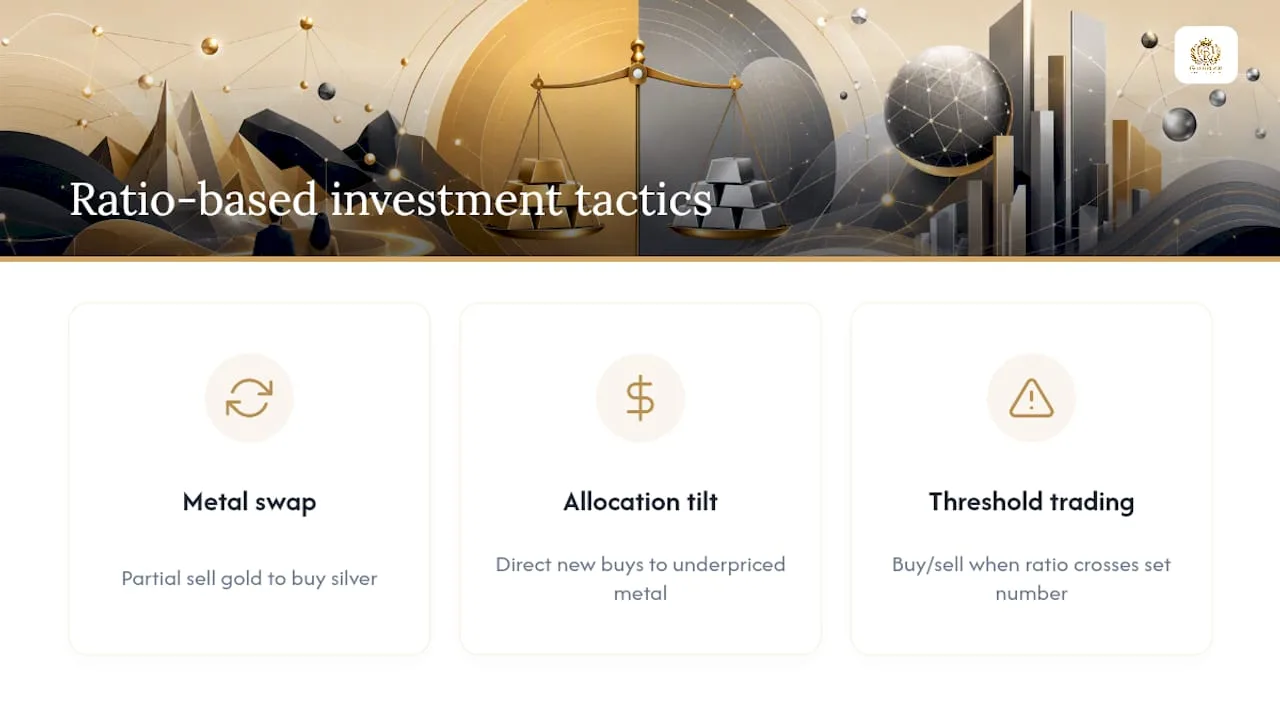
The second is allocation tilting during new purchases rather than trading existing holdings. Instead of swapping metals, an investor simply directs a higher percentage of new precious-metals purchases toward whichever metal looks historically underpriced by the ratio, leaving existing holdings untouched. This avoids transaction costs and tax events tied to selling one metal to buy another.
The third, and the one most often overstated in casual commentary, is binary threshold trading, buying or selling entirely based on the ratio crossing a specific number like 80 or 100. This approach ignores the statistical reality that the ratio can sit far from its equilibrium for extended stretches, sometimes years, before correcting.
None of these strategies eliminates risk. Silver’s industrial demand growth from sectors like solar manufacturing means the ratio’s behavior going forward may not mirror its historical pattern exactly, which is a reason to treat any single strategy built around it as one piece of a broader plan rather than a standalone system.
A Grounded View on Using the Ratio Well
The ratio rewards patience, not precision. Investors who treat it as a long-term allocation input, rather than a timing device, tend to get more out of it than those chasing threshold crossings. Whatever you decide, think through ownership method and custody just as carefully as the number itself.
— Blake
Get Personalized Guidance on Applying the Ratio
Reading the ratio correctly is only half the equation. Deciding how to act on it, physical delivery to your door, allocated storage, or a self-directed Precious Metals IRA rollover, depends on your retirement timeline, tax situation, and how hands-on you want custody to be. GoldRock Metal Exchange’s in-house IRA department handles rollovers from existing retirement accounts into physical gold, silver, platinum, or palladium, and pairs every purchase with insured private delivery when direct possession is what you want instead.

Every client gets one-on-one guidance rather than a generic order form, whether you’re rebalancing an existing holding or opening a self-directed IRA for the first time. Check current live prices to see where the ratio stands today, then Request a Free Precious Metals Consultation by calling (888) 859-0978 to talk through what fits your situation.
Sources
- Gold-silver ratio — Britannica
- Is the Gold-Silver Ratio Relevant Today — Silver Institute (2026)
- Gold/silver ratio — Investopedia
- Findbullionprices
This article is for educational purposes only and does not constitute investment, tax, or or legal advice. Precious metals prices fluctuate, and past patterns in the gold-to-silver ratio do not guarantee future performance. Consult a qualified financial, tax, or legal professional before making investment decisions.
This article is general information, not a substitute for advice from a qualified financial advisor. Consult a qualified financial professional about your own circumstances before acting on anything here.